 PSA
PSAFrom a record grading backlog to a controlled recovery system.
Luna Sol assessed the operating constraint, designed immediate stabilization mechanisms, and developed the capacity, governance, and continuous-improvement roadmap behind recovery.
✓Evidence checkedOfficial PSA updates plus dated external reporting
Live integration · PSA’s public backlog tracker
Public performance during the engagement period; not presented as solely attributable to Luna Sol.
Executive brief01
The visible queue was the symptom. The system around it was the problem.
A 20% submission spike added 1.6 million cards in two weeks. The active backlog approached 10 million, four Value tiers paused, and a final pre-pause influx pushed the queue near 14 million.
- Role
- Senior operations advisor
- Mandate
- Stabilize · Design · Govern
- Operating lens
- Capacity · Quality · Service levels
- Evidence standard
- Primary + dated external sources
The challenge02
Recovery required more than pushing additional volume through the line.
Leadership had to reconcile intake controls, service-level economics, facilities, staffing, technology, quality, and customer trust—while preparing for latent demand that could return when Value reopened.
The mandate was to identify the active constraint, deploy near-term countermeasures, and create the governance and capacity mechanisms needed to keep reducing the queue without trading away quality.
What I designed03
Three operating pillars connected immediate recovery to durable control.
- 01Signal integrity
- 02Constraint economics
- 03Operating architecture
- 04Adoption
- 05Control
Diagnose and stabilize
Identify the binding constraint, protect throughput, and prevent short-term countermeasures from creating the next bottleneck.
- Constraint diagnosis
- Queue controls
- Near-term countermeasures
Build the capacity system
Connect facilities, staffing, technology, service levels, and quality in one decision-grade capacity model.
- Capacity scenarios
- Service-level economics
- Quality guardrails
Install control and reopen responsibly
Define owners, thresholds, governance, and latent-demand triggers so recovery decisions remain tied to operating evidence.
- Executive cadence
- Trigger framework
- Reopening roadmap
Signature operating view
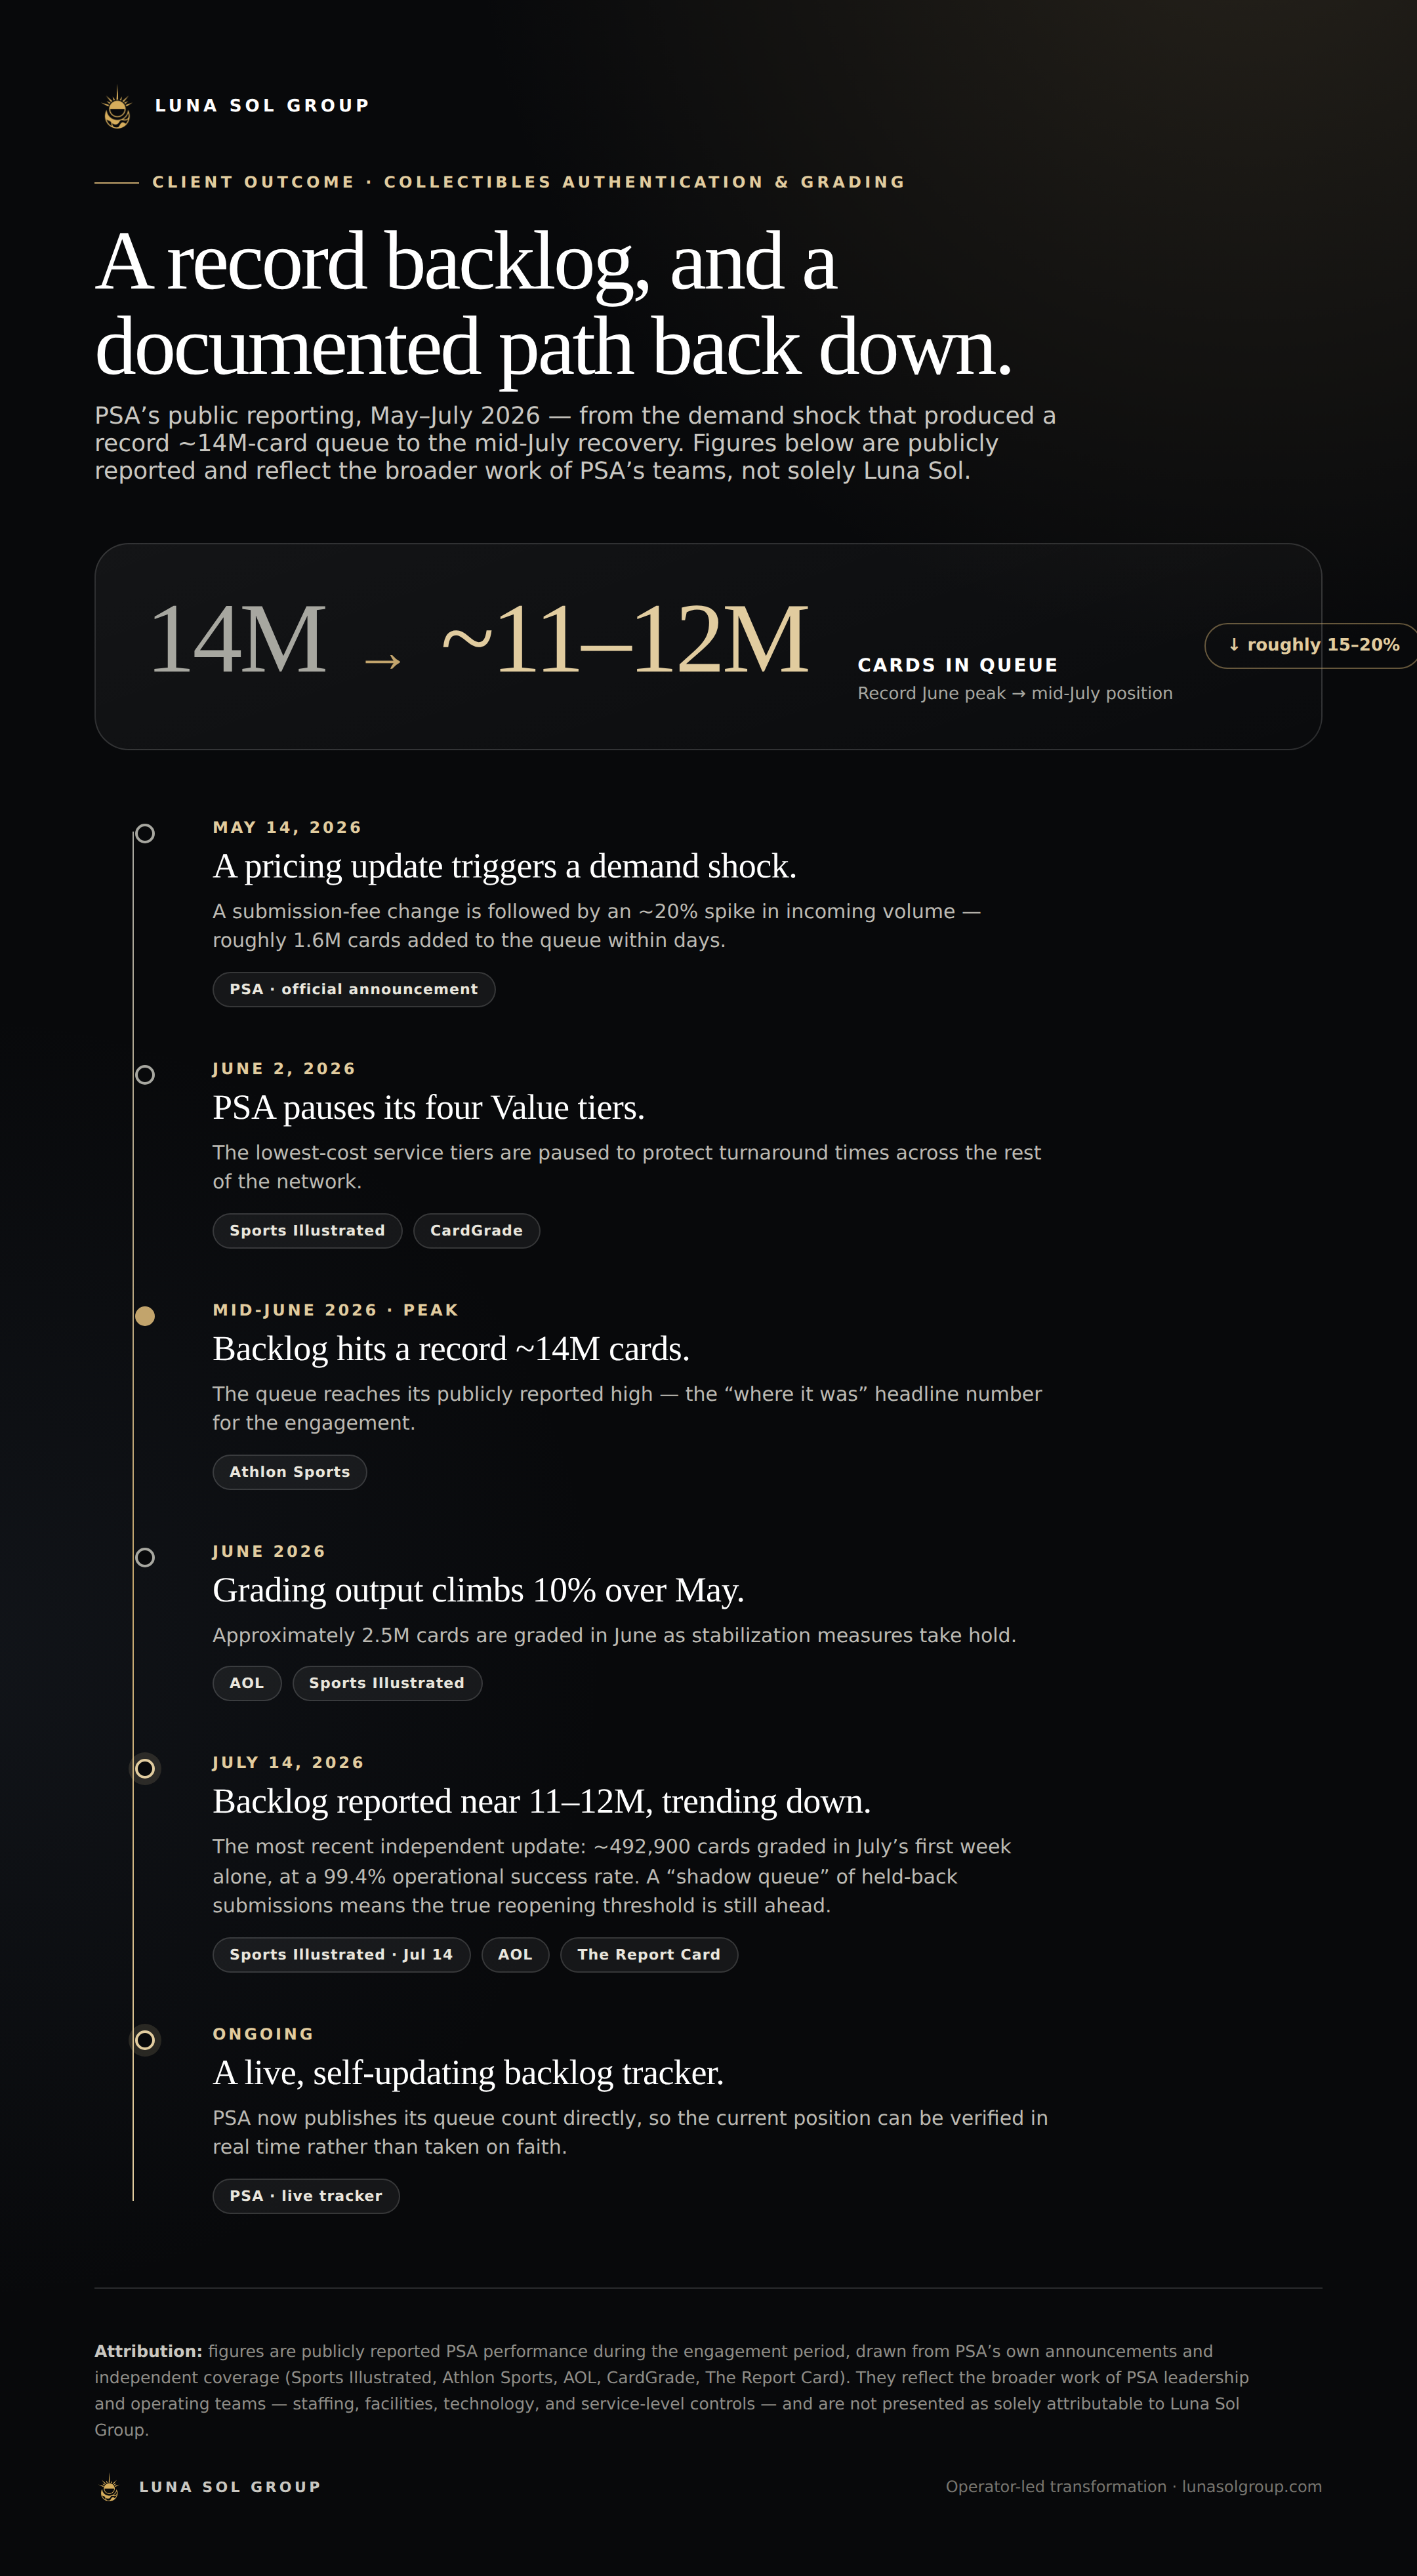
Six checkpoints from shock to controlled recovery.
Each point is tied to a dated public source, separating official operating facts from external interpretation.
- 01
Pricing and capacity signal
PSA announced a $200 million infrastructure commitment and updated service expectations.
- 02
Pause announced
A 20% demand spike added 1.6 million cards; Value tiers were scheduled to pause.
- 03
Intake control activated
Four Value tiers closed to new submissions so throughput could attack the active queue.
- 04
Queue peaks near 14 million
A pre-pause influx pushed the active backlog materially above the initial estimate.
- 05
Recovery becomes visible
PSA reported approximately 12 million units and a downward trend.
- 06
11 million checkpoint
Output accelerated while PSA reported a 99.4% operational success rate.
Working decision tool
Launch the model PSA Recovery Digital Twin
Adjust demand, capacity, utilization, quality loss, aging work, surge capacity, and productivity assumptions to test the recovery mechanics.
View the portfolio timeline artifactOpen +
Downloadable artifact
The complete operating timeline.
A 1080-pixel editorial timeline for executive review and portfolio use.
Download PNG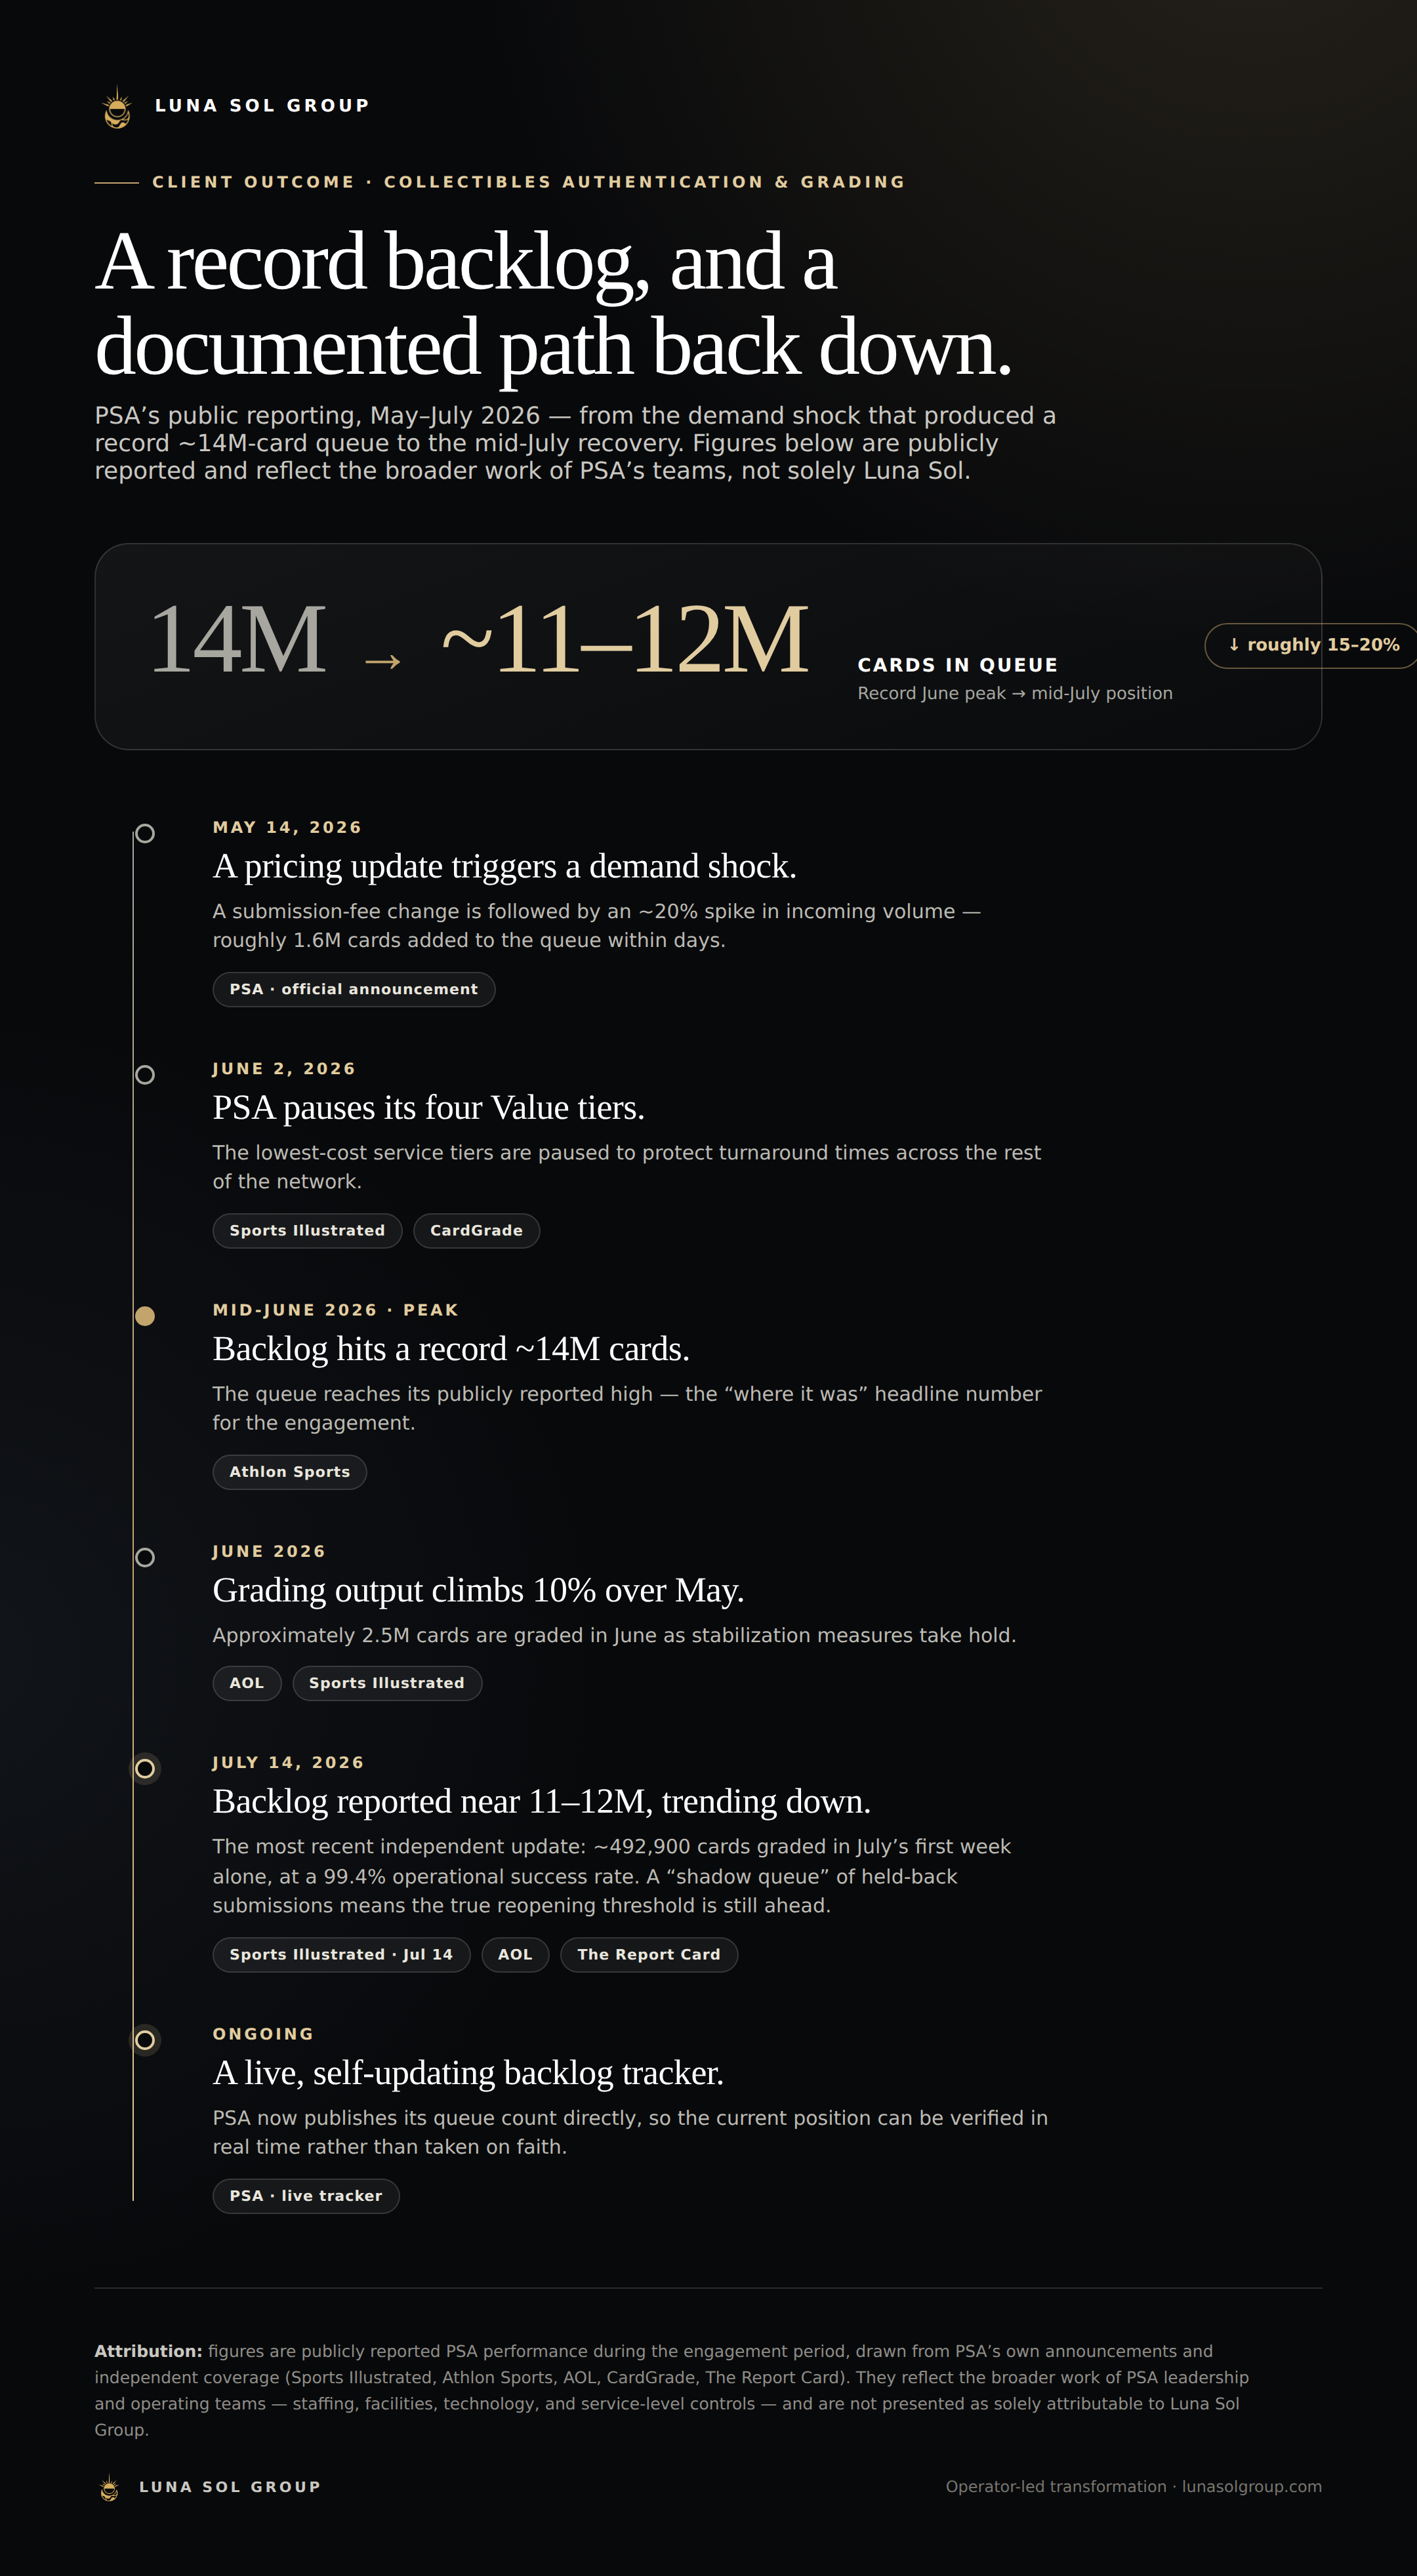
Inspect the sanitized decision artifactsOpen +
01Sanitized portfolio reconstruction
Constraint tree
- Decision supported
- Where to intervene first
- Inputs
- Queue, intake, cycle-time, quality, staffing
- Analysis
- Causal decomposition
- Output
- Binding-constraint hypothesis
- Leadership use
- Align the stabilization sequence
02Sanitized portfolio reconstruction
Capacity + recovery model
- Decision supported
- What recovery path is feasible
- Inputs
- Demand, rated capacity, utilization, rework
- Analysis
- Flow and sensitivity modeling
- Output
- Burn rate, capacity gap, threshold date
- Leadership use
- Compare countermeasures and risk
03Sanitized portfolio reconstruction
13-week stabilization roadmap
- Decision supported
- How to govern execution
- Inputs
- Workstreams, owners, triggers, dependencies
- Analysis
- Critical-path and control design
- Output
- Milestones, KPIs, escalation cadence
- Leadership use
- Run weekly executive governance
Portfolio reconstructions communicate the work structure without exposing client-confidential inputs, analysis, or internal documents.
Supported impact04
One engagement. Two distinct evidence layers.
What Luna Sol delivered
- ✓Current-state operating assessmentLuna Sol deliverable
- ✓Constraint and causal analysisLuna Sol deliverable
- ✓Capacity and flow modelLuna Sol deliverable
- ✓Immediate stabilization countermeasuresLuna Sol deliverable
- ✓KPI and governance architectureLuna Sol deliverable
- ✓Long-term operating roadmapLuna Sol deliverable
What PSA publicly reported
- ≈14m → 11mBacklog arcPublicly reported · official + independent
- 2.50mJune grading volumeIndependent market report · GemRate
- >10%Output above prior monthly highPublicly reported · official
- 492.9kCards graded July 1–6Independent market report · GemRate / SI
- 99.4%Operational success ratePublicly reported · official
Attribution: These figures represent publicly reported PSA performance during the engagement period and reflect the broader work of PSA leadership and operating teams. They are not presented as solely attributable to Luna Sol.
Evidence05
Primary evidence first. Full source room on demand.
01
Primary source · May 28, 2026PSA service-level update
↗02Independent coverage · July 13, 2026Athlon: from 14 million toward recovery
↗03Independent market data · July 1, 2026GemRate: June 2026 grading recap
↗04Primary source · Live · Updated bi-weeklyPSA backlog tracker
↗View all 9 checked sourcesOpen +
01PSA service-level updatePrimary source · May 28, 2026↗02PSA backlog trackerPrimary source · Live · Updated bi-weekly↗03Sports Illustrated: grading pause confirmedIndependent coverage · May 28, 2026↗04Athlon: from 14 million toward recoveryIndependent coverage · July 13, 2026↗05CardGrade: implications of the Value-tier pauseMarket context · Updated July 8, 2026↗06Sports Illustrated: 11 million still backloggedIndependent update · July 15, 2026↗07AOL: backlog drops from 14 to 12 millionSyndicated coverage · July 13, 2026↗08The Report Card: the shadow-queue riskExternal analysis · July 4, 2026↗09GemRate: June 2026 grading recapIndependent market data · July 1, 2026↗
Validation boundary: No client testimonial is published without explicit approval. Engagement scope and public operating evidence are therefore presented as separate, labeled claims.